Hi
Parents! Our school has purchased DreamBox Learning's Math Program, an online,
Intelligent Adaptive Learning(tm) program that helps all students achieve
better, faster math proficiency. Your student can access DreamBox Learning from
any computer, 24 hours a day, 7 days a week using this link:
https://play.dreambox.com/login/pwte/phapThursday, 28 January 2016
Sunday, 24 January 2016
Food Availability
Use
the following websites to assist you in completing your health worksheet
(choice of tasks):
Thursday, 21 January 2016
Test Review
-
analyze data to make inferences and convincing arguments
-
find the mean, median, and mode (+ range)
-
choose an appropriate graph to display data
-
compare different displays of the same data
-
draw bar graphs, line graphs, and scatter plots
-
evaluate collected data and explain how the data represent the population
-
plot and describe the location of points on a Cartesian plane.
Image source: http://www.somersetroadsafety.org/page/data-management/173/
Image source: http://www.somersetroadsafety.org/page/data-management/173/
Thursday, 14 January 2016
Data Quiz- Can I?
- analyze data to make inferences
and convincing arguments
- find the mean, median, and mode (+
range)
- choose an appropriate graph to
display data
- compare different displays of the
same data
- draw bar graphs, line graphs, and
scatter plots
- evaluate collected data and
explain how the data represent the population
- plot and describe the location of
points on a Cartesian plane.
Source: https://www.youtube.com/watch?v=MK3-MtrvSWs
Tuesday, 12 January 2016
Community Exploration: Town Rankings
Our newest
Social Studies assignment will involve an analysis of changes in the ethnic
makeup of the following communities: Markham, Richmond Hill, Newmarket,
Timmins, Brampton, Peterborough, Mississauga, London. You will compare both
photographs and population data.
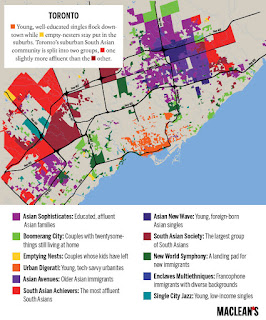
Photo source: http://www.macleans.ca/news/canada/mapped-10-years-of-unprecedented-change-in-canadas-cities/
1. Learn a
little about each of the communities above (all towns in Ontario).
2. Find a
historical photo of each community.
3. Use
Google Map’s “Streetview”. Snip or print-screen your findings to do a side by
side photo comparison (it would be especially cool if you could compare the
same street).
4. Compare
the past and present using the images AND websites from the previous demography
assignment (ethnic breakdown of each community/city in graph, or table form).
5. Your goal
is to make an informed decision about which communities are the MOST culturally
similar to the past, and which communities are the LEAST culturally similar to
the past.
Graphs,
charts, and data tables will come from a previous blog post. Other useful
websites may include the official city/town websites, which I've linked for you
below.
Markham: http://www.markham.ca/
Richmond
Hill: http://www.town.richmond-hill.on.ca/homepage.asp
Newmarket: http://www.newmarket.ca/en/
Timmins: http://www.timmins.ca/
Peterborough:
http://www.city.peterborough.on.ca/site3.aspx
Mississauga: http://www.mississauga.ca/portal/home
Saturday, 9 January 2016
Demography: Tech Time
We are
learning to demonstrate an understanding of the importance of immigration in
the development of Canada. According to Statistics Canada, 1 out of 5 people in
Canada's population is foreign-born. Immigrant source countries have changed
drastically over the past hundred years. Linking to our Math, Art, and Social Studies
units, this is what we will investigate in tech time.
1) Take out the source country predictions sheet you completed last week.
2) "Check" your predictions by completing the chart in your package (also linked below).
3) Connect to Data Management (blank sheet at the back of your package)to Social Studies by printing (or copying/pasting) at least 5 different maps, charts, and tables
relating to Canadian immigration history—past or present (especially data
beyond 2000)
4) Caption
each graph or table to provide context (explanation of data shown, source, year,
etc).
5) Due: tomorrow
Document: https://drive.google.com/a/gapps.yrdsb.ca/file/d/0B6LKqXTmeAPKUVBCWGxxNHFEMjg/view?usp=sharing
Subscribe to:
Comments (Atom)


